
How to Generate Staff Productivity Reports?
The Staff Productivity report is for looking closely at one employee’s productivity. Open it from Reports > Staff Productivity in the left menu.
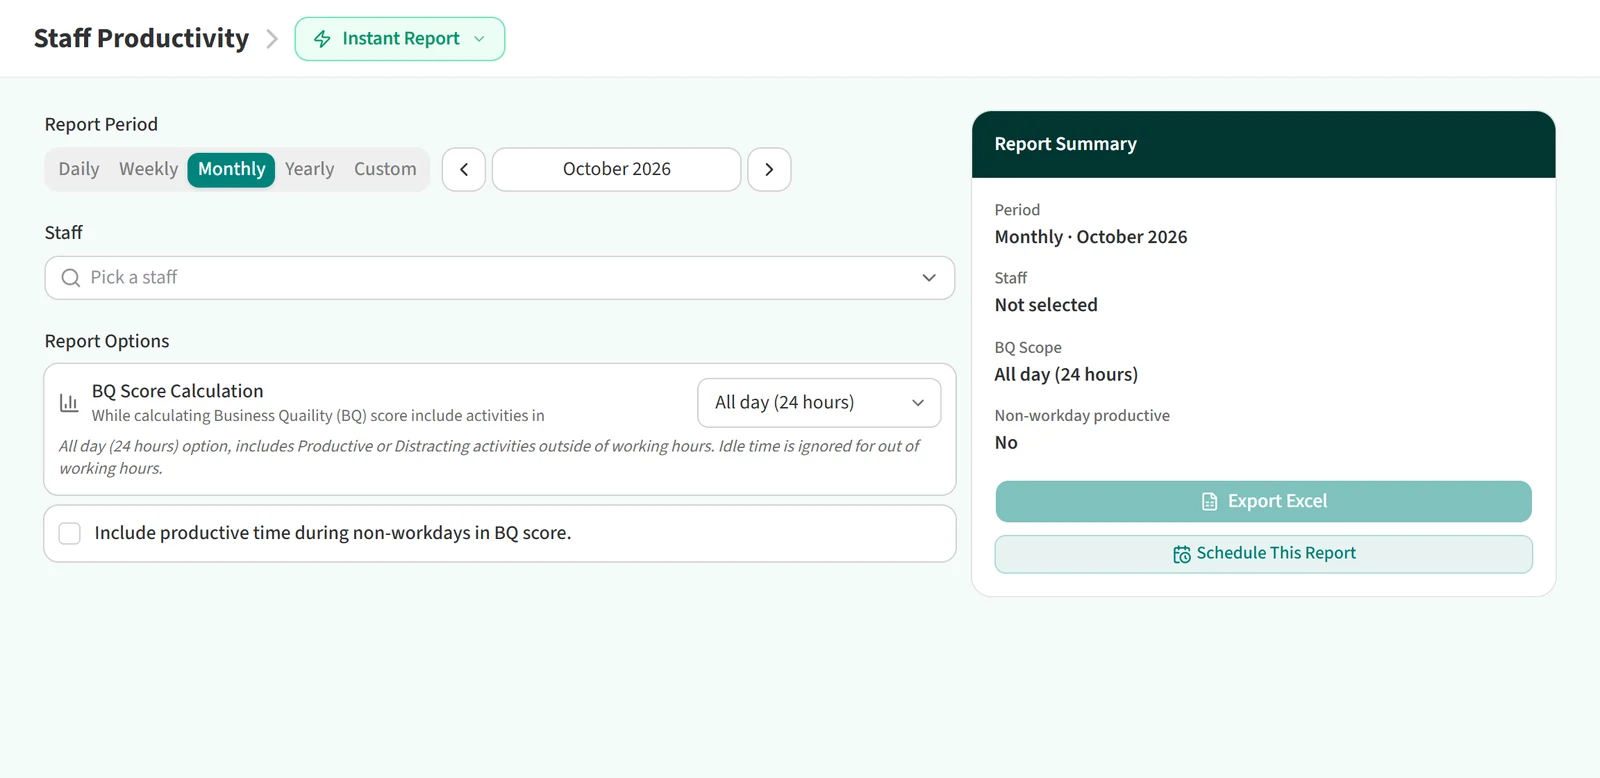
Report period
Under Report Period, choose Daily, Weekly, Monthly, Yearly or Custom. For the fixed periods, the arrows move to the previous or next period.

Staff selection
In the Staff field, pick the person the report is about. You need to pick someone before you can download: until then Export Excel stays disabled.

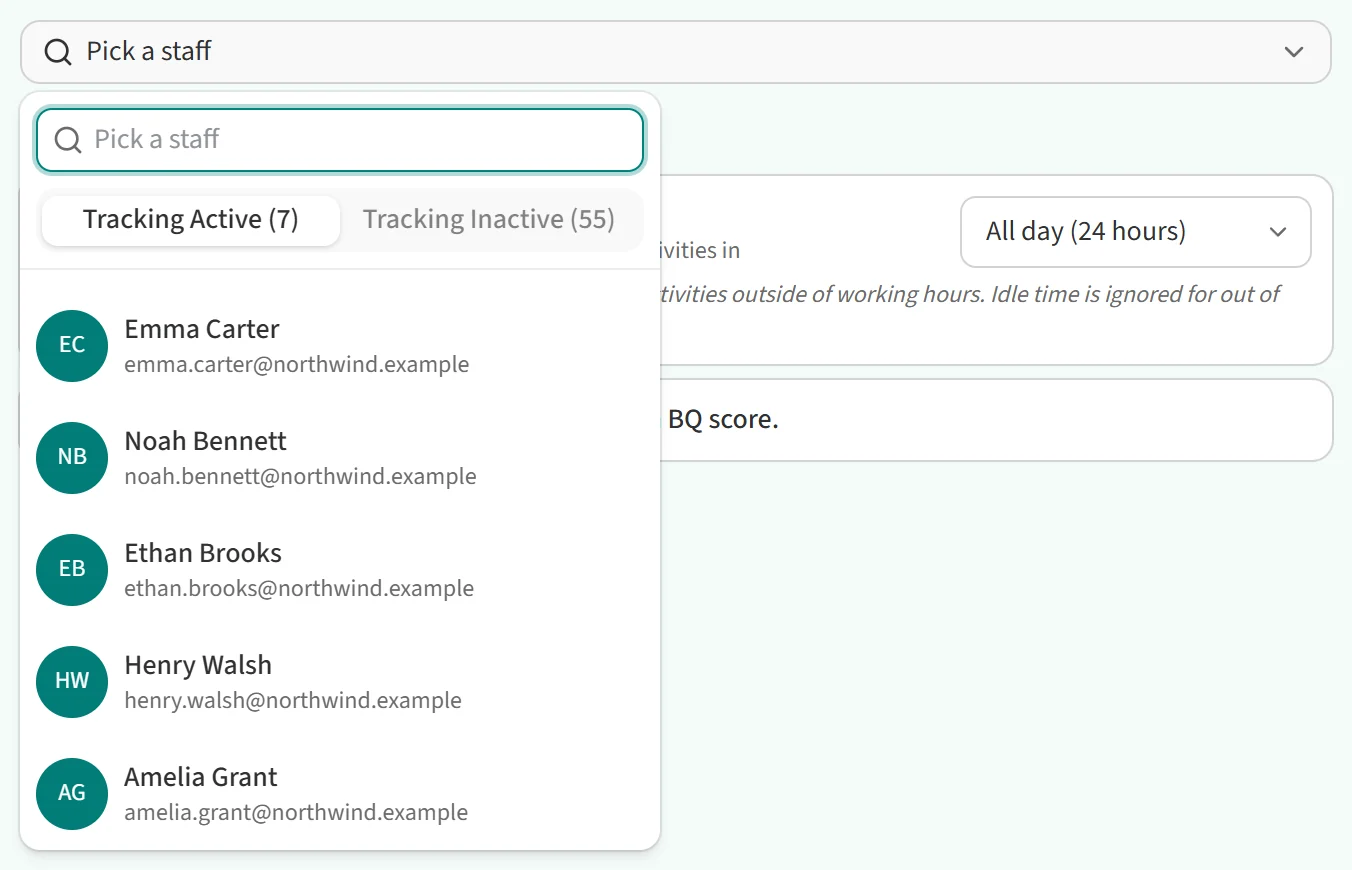
When you open the list, people are split into Tracking Active and Tracking Inactive tabs. To get a report for someone who is no longer tracked, for example an employee who has left, switch to Tracking Inactive. You can also type a name in the search box.
Report options
BQ Score Calculation has two options: All day (24 hours) and Working hours only. All day includes productive and distracting activity outside working hours and ignores idle time outside working hours.

If you tick Include productive time during non-workdays in BQ score., productive time on days that are not workdays also counts toward the BQ score.
Daily staff productivity report
- Open Reports > Staff Productivity in the left menu.
- Under Report Period, choose Daily and set the date.
- Pick the person in the Staff field.
- Under BQ Score Calculation, choose All day (24 hours) or Working hours only.
- Click Export Excel.
The daily report has two tabs: Daily Activity Statistics and Daily Timeline.
Daily Activity Statistics
This tab lists the employee’s activity statistics for the day in detail.

Daily Timeline
This tab shows the employee’s day as a visual timeline.

Weekly, monthly and yearly staff productivity reports
- Open Reports > Staff Productivity in the left menu.
- Under Report Period, choose Weekly, Monthly, Yearly or Custom and set the period.
- Pick the person in the Staff field.
- Choose the BQ Score Calculation option.
- Click Export Excel.
For these periods the Excel file has four tabs: List View, Activity Statistics, BQ Score Chart and Hours Spent Chart.
List View
Lists the work in the selected period, with dates, working hours, working days, BQ score, start and end times and more.

Activity Statistics
Shows total activity time and the applications used in the period. Applications are split into productive and unproductive, and idle time is shown separately.

BQ Score Chart
Charts the employee’s BQ scores over the period.

Hours Spent Chart
Charts the employee’s productive, unproductive and idle hours over the period.

Scheduling the report
Use Schedule This Report in the Report Summary card to have the report sent regularly. You do not have to pick a person to schedule it. If no one is selected, each recipient gets their own report.
You may also be interested in: How to Get the Office Activity Report?